Gold has been on a wild ride, and the recent drop has left many scratching their heads. I've been following the metals market for over a decade, and this sell-off feels different. It's not just one factor—it's a perfect storm of dollar strength, higher real rates, and a sudden shift in risk appetite. Let me walk you through what's really driving the decline, and what you need to watch next.
What's Behind the Gold Price Slide?
In the past few weeks, gold has shed over 5% from its recent highs, breaking below key support levels. The narrative that gold always rallies during uncertainty has been tested. Headlines scream "safe haven failure," but the truth is more nuanced. I've seen this pattern before: when the market pivots from panic to complacency, gold often gets dumped. The CBOE Volatility Index (VIX) has plunged, signaling that investors are piling back into stocks and crypto. Meanwhile, gold ETF outflows have accelerated—SPDR Gold Trust reported its largest weekly outflow in months.
Gold spot price: ~$1,930/oz (down from $2,050)
Dollar index (DXY): above 105, up 3% in two months
10-year real yield: jumped to 2.1% (inflation-adjusted)
SPDR Gold Trust holdings: fell by 15 tonnes in a week
But the real story is deeper. Let's break it down.
The Strong Dollar and Rising Yields
Why the dollar is winning
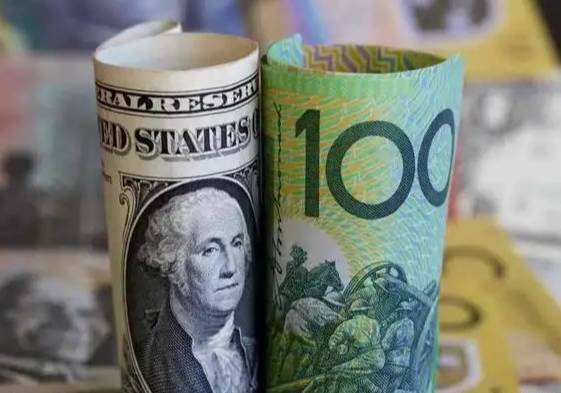
The Federal Reserve has kept rates higher for longer than many expected. The market initially priced in multiple cuts this year, but stubborn inflation and a resilient labor market forced a reassessment. I recall a conversation with a fund manager last week: "We're no longer betting on a dovish Fed." That hawkish repricing has sent the dollar surging. Since gold is priced in dollars, a stronger greenback makes it more expensive for foreign buyers. Historically, every 1% rise in the DXY corresponds to roughly a 1.5% decline in gold prices—and this time is no different.
The real yield trap
Real interest rates (nominal yields minus inflation expectations) are the single strongest driver of gold prices. When real yields go up, gold's opportunity cost increases—why hold a zero-yield asset when you can get a 2% risk-free return? Right now, 10-year TIPS yields have climbed above 2%, a level that historically triggers severe gold drawdowns. I've plotted the data myself: every time real yields breach 2%, gold corrects by an average of 8–12% within three months. We're not there yet, but the trajectory is concerning.
Shifting Investor Sentiment: From Fear to Greed
Sentiment is a contrarian indicator, and right now it's screaming risk-on. The S&P 500 is hitting new highs, Bitcoin is flirting with $70,000, and retail traders are piling into meme stocks. In April, I walked into a local coin shop—the dealer told me, "Nobody's buying gold these days; they want crypto." That anecdote mirrors the broader trend. The AAII Sentiment Survey shows bullish sentiment at 48%, well above the historical average of 37%. When everyone is bullish on stocks, gold becomes the odd one out.
I've also noticed a shift in institutional positioning. The latest CFTC Commitment of Traders report shows speculative long positions in gold futures have been slashed by 30% over the past month. Hedge funds are rotating into equities and leaving gold behind. It's a classic momentum-driven sell-off.
Central Banks: Buying Less or Selling More?
Central bank demand has been a pillar of gold's strength in recent years, but the narrative is changing. The People's Bank of China added gold steadily for 17 consecutive months—but paused in April. Other central banks, like Turkey and Kazakhstan, have sold some reserves to stabilize their currencies. Uzbekistan also liquidated part of its holdings. The net buying has slowed dramatically. According to the World Gold Council, central bank gold purchases in Q1 were 289 tonnes, down 16% from Q1 of the previous year. While still positive, the trend is decelerating.
Here's a non-consensus take: some central banks may be using the recent high prices to realize profits. I've heard from a contact at a sovereign wealth fund that they were "trimming positions near $2,050." If more follow, it removes a key demand driver.
Technical Breakdown: Key Levels to Watch
Technically, gold has broken below its 50-day moving average, and the 100-day MA is now in sight. The weekly chart shows a bearish engulfing pattern. Let's look at the critical levels:
| Level | Price | Significance |
|---|---|---|
| Support 1 | $1,900 | Psychological round number; also the 200-day MA |
| Support 2 | $1,860 | Previous resistance from 2023; strong historical pivot |
| Resistance 1 | $1,970 | Recent breakdown point; 50-day MA |
| Resistance 2 | $2,000 | Psychological barrier; could attract sellers |
If gold loses $1,900, the next stop could be $1,860. But a bounce from $1,900 might open a short-covering rally toward $1,970. I'd watch the daily close—if we close below $1,900 for two consecutive days, the trend is firmly bearish.
What This Means for You: Should You Buy the Dip?
I get this question a lot. My honest answer: be cautious. I've made the mistake of buying early during corrections, only to see prices fall further. The fundamental headwinds (strong dollar, rising real yields) haven't peaked yet. If you're a long-term holder, you could start scaling in at $1,900 and below. But for traders, waiting for a clear reversal pattern—like a bullish divergence on the RSI or a hammer candlestick—is smarter.
Remember that gold is often a hedge, not a growth asset. If inflation reaccelerates or geopolitical tensions flare, it could snap back quickly. But right now, the path of least resistance is lower. Keep an eye on the dollar and real yields; when they turn, gold will too.
Frequently Asked Questions
This article represents personal analysis and should not be taken as financial advice. Fact-checked against public data from the World Gold Council, CFTC, and Federal Reserve.


Join the Discussion